Chapter 13: Statistics
๐Ÿ‡ฎ๐Ÿ‡ณ National Curriculum Standard โ–พ
๐Ÿ› Vidyoric Certified โ€ข Prof. Arvind Swaminathan
๐Ÿ”ฅ 0 days
โšก 0 Sparks +
Chapter 13: Statistics

Video Lecture: The Measures of Central Tendency: Extracting Truth from Data

STEP 1: VIDEO LESSON ๐Ÿ“ค Uploaded HTML5 Video

๐Ÿ“‘ Interactive Chapter Bookmarks

0 chapters

๐ŸŽ™๏ธ Synchronized Transcript

๐Ÿ”
# Video Lecture Production Script โ€” Chapter 13: Statistics
## Title: The Measures of Central Tendency: Extracting Truth from Data
**Target Duration**: 06:45 minutes
**Format**: 1080p 60fps Full HD Statistical Data Visualization
**Lead Presenter**: Prof. Arvind Swaminathan (Senior NCERT Mathematics Faculty)

---

### [00:00 - 01:15] Movement 1: From Chaos to Clarity
**Visual**: A torrential waterfall of random numbers cascades down a digital screen. The presenter steps in front of an interactive data wall. With a wave of a hand, the waterfall condenses into a neat frequency distribution histogram. Three radiant vertical lines pierce the distribution: one in emerald (Mean), one in amber (Median), and one in rose (Mode).
**Voiceover (Prof. Swaminathan)**:
"Namaskar students! In modern science, economics, and medicine, we are inundated with data. A clinical trial tests a vaccine on tens of thousands of patients. An election surveys millions of voters. A census counts a billion citizens.

If you handed a government minister a list of one hundred thousand raw numbers, it would be useless. We need single representative numbers that capture the essence of the entire distribution.

In Chapter 13, we master the three classic pillars of central tendency for continuous grouped data: the Mean, the Mode, and the Median. Let us explore how each tells a unique story."

---

### [01:15 - 02:45] Movement 2: The Three Methods of the Mean
**Visual**: A grouped frequency table appears. The class marks $x_i$ light up as the midpoints: $\frac{\text{Upper} + \text{Lower}}{2}$. Three algorithmic calculation paths branch out: Direct, Assumed Mean ($d_i = x_i - a$), and Step-Deviation ($u_i = \frac{x_i - a}{h}$).
**Voiceover (Prof. Swaminathan)**:
"The **Mean** is the arithmetic balance point of your data. If you placed the histogram on a physical fulcrum, the mean is the exact coordinate where the distribution would balance in perfect equilibrium.

For grouped data, we treat every observation in a class as concentrated at its midpointโ€”the **Class Mark** $x_i$.
You have three paths to find the mean:
First, the **Direct Method**: $\bar{x} = \frac{\sum f_i x_i}{\sum f_i}$. Simple, but tedious when numbers are large.
Second, the **Assumed Mean Method**: Choose a middle class mark as your anchor $a$, and compute deviations $d_i = x_i - a$. The mean is $a + \frac{\sum f_i d_i}{\sum f_i}$.
Third, the supreme exam weaponโ€”the **Step-Deviation Method**: Scale down the numbers by dividing by class width $h$: $u_i = \frac{x_i - a}{h}$.
$$\bar{x} = a + \left(\frac{\sum f_i u_i}{\sum f_i}\right) \times h$$
Look at how small and friendly the numbers become! Calculation errors evaporate."

---

### [02:45 - 04:15] Movement 3: The Mode โ€” Peak Popularity
**Visual**: A bar chart peaks sharply at a central bar. The highest bar is labeled $f_1$. The bar to its left is $f_0$. The bar to its right is $f_2$. Dynamic interpolation lines cross inside the modal bar, pinpointing the mode along the horizontal axis.
**Voiceover (Prof. Swaminathan)**:
"While the mean is the balance point, the **Mode** is peak popularity!
A shoe manufacturer does not care about the 'mean' shoe sizeโ€”they cannot manufacture size 7.84! They want to know the **most frequently purchased** shoe size so they can stock their shelves. That is the Mode!

In grouped data, we first locate the **Modal Class**โ€”the interval with the highest frequency $f_1$.
Then we pinpoint the mode within that class using this precise formula:
$$\text{Mode} = l + \left(\frac{f_1 - f_0}{2f_1 - f_0 - f_2}\right) \times h$$
Notice the natural sequence of indices: $f_0$ is the preceding class, $f_1$ is the modal class, and $f_2$ is the succeeding class. Zero, one, two!"

---

### [04:15 - 05:30] Movement 4: The Median โ€” The Middle of the Population
**Visual**: A cumulative frequency curve rises smoothly. The total count $n = 60$ is halved to $n/2 = 30$. A horizontal dotted line shoots across from $30$ on the vertical axis, hits the curve, and drops down to the horizontal axis at $28.5$.
**Voiceover (Prof. Swaminathan)**:
"The **Median** is the true physical middle of the population. Exactly fifty percent of the observations lie below the median, and fifty percent lie above it.

To find the median:
1. Build the cumulative frequency column.
2. Find $n/2$.
3. Locate the **Median Class**โ€”the class whose cumulative frequency is just greater than $n/2$.
4. Apply the median formula:
$$\text{Median} = l + \left(\frac{\frac{n}{2} - cf}{f}\right) \times h$$
Here is the number one trap in board exams: What is $cf$?
$cf$ is the cumulative frequency of the **preceding class**, while $f$ is the frequency of the **median class itself**! Never confuse the two!"

---

### [05:30 - 06:45] Movement 5: The Empirical Law & Your Mission
**Visual**: The empirical equation appears in bold glowing letters: $3 \times \text{Median} = \text{Mode} + 2 \times \text{Mean}$. Interactive dial gauges show that adjusting any two automatically predicts the third.
**Voiceover (Prof. Swaminathan)**:
"Finally, Karl Pearson gave us the empirical bridge that unites all three:
$$\text{Mode} = 3 \times \text{Median} - 2 \times \text{Mean}$$
If an exam gives you the mean and median, you can instantly find the mode without touching the raw data!

In this deck, you will master step-deviation tables, conquer dual missing frequency problems, test your recall with 22 flashcards, and ace 20 board exam diagnostic MCQs. Let's step into the notes!"
STEP 2 โ€ข CONCEPT NOTES โฑ๏ธ 5 min read
๐Ÿ“Œ 0 Notes

Class Marks & The Direct Mean Method

Lead Educator: Prof. Arvind Swaminathan (Senior NCERT Mathematics Faculty)


? Visual Concept Diagrams & Figures
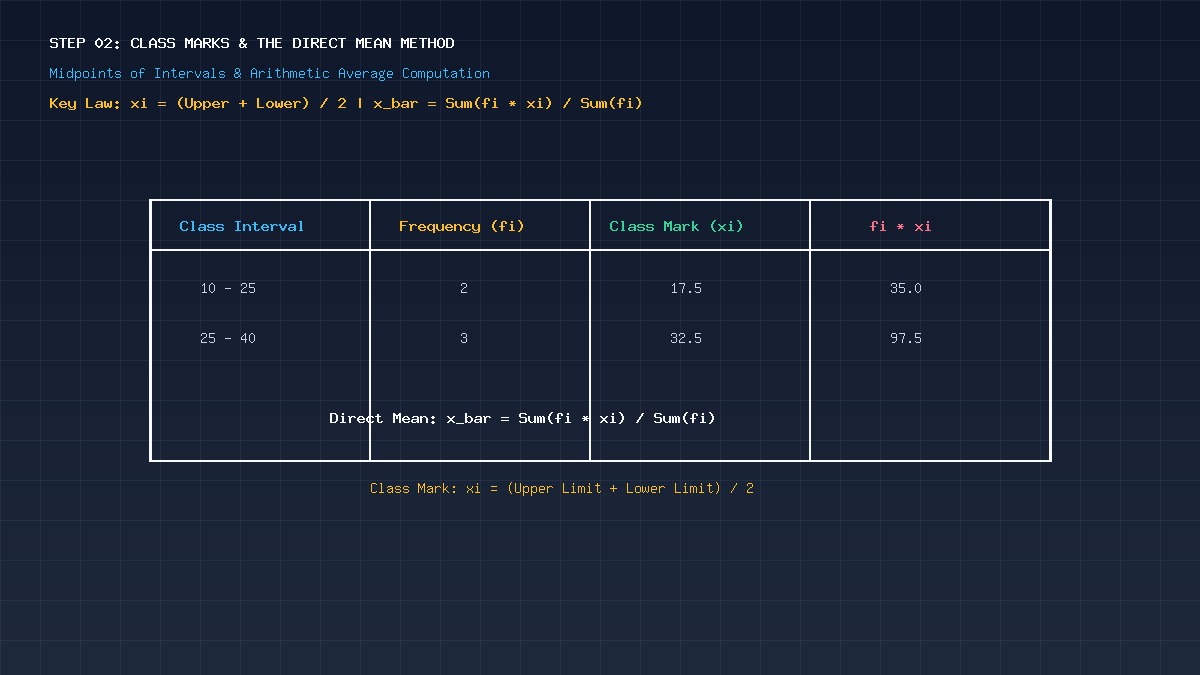
Figure 13.1: Class Marks and Direct Mean Method


1. The Class Mark Convention

For continuous grouped data where individual values are unknown, we assume the frequency of each class is centered at its midpoint:

$$\mathbf{x_i = \frac{\text{Upper Class Limit} + \text{Lower Class Limit}}{2}}$$

2. The Direct Method Formula

$$\mathbf{\bar{x} = \frac{\sum_{i=1}^n f_i x_i}{\sum_{i=1}^n f_i} = \frac{\sum f_i x_i}{N}}$$
Standard Example:
Class IntervalFrequency ($f_i$)Class Mark ($x_i$)$f_i x_i$
$10 - 25$$2$$17.5$$35.0$
$25 - 40$$3$$32.5$$97.5$
$40 - 55$$7$$47.5$$332.5$
$55 - 70$$6$$62.5$$375.0$
$70 - 85$$6$$77.5$$465.0$
$85 - 100$$6$$92.5$$555.0$
Total$\sum f_i = 30$โ€”$\sum f_i x_i = 1860.0$
$$\bar{x} = \frac{1860}{30} = \mathbf{62}$$
๐Ÿ“
Comprehensive High-Yield Mathematical Relations & Theorems

Complete step-by-step derivations, step traps, and LaTeX formula sheet breakdowns...

๐Ÿ”’

End of Free Notes Preview

Unlock the complete deck to access full LaTeX formula breakdowns, interactive diagrams, exam traps, and personal margin highlights!

๐Ÿ”‘ Sign In / Register Free
STEP 3 โ€ข CONCEPT NOTES โฑ๏ธ 5 min read
๐Ÿ“Œ 0 Notes

The Assumed Mean Method

Lead Educator: Prof. Arvind Swaminathan (Senior NCERT Mathematics Faculty)


? Visual Concept Diagrams & Figures

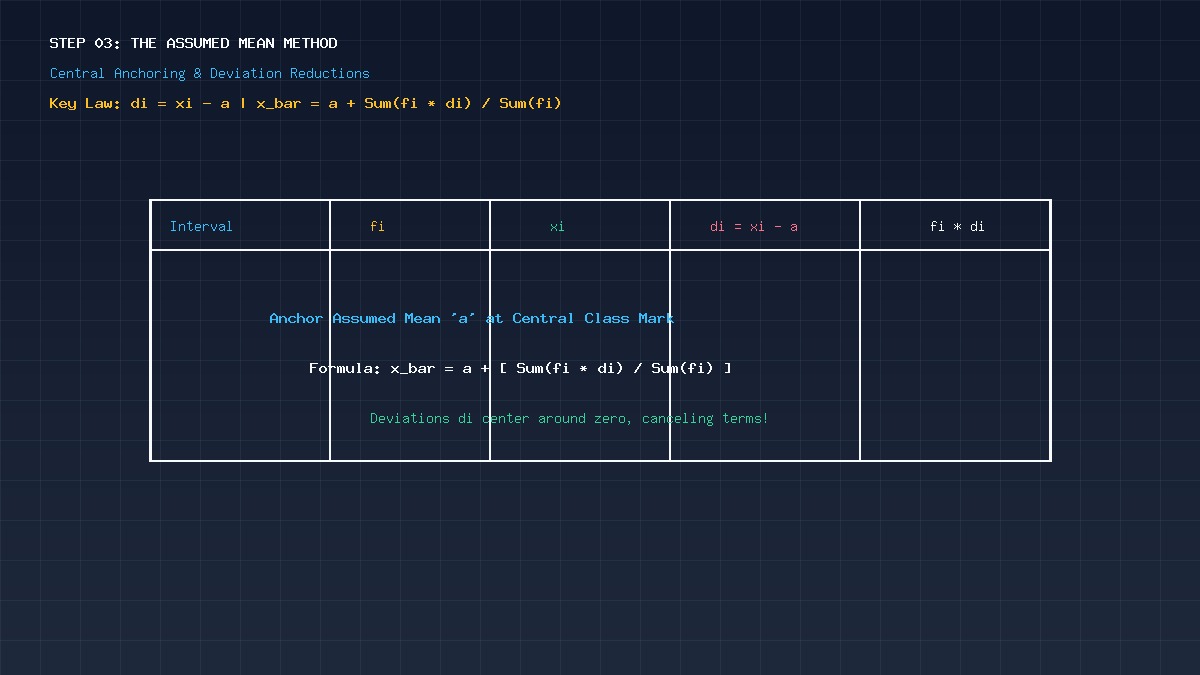
Figure 13.2: Assumed Mean Method and Deviations


1. Why Use Assumed Mean?

When class marks $x_i$ and frequencies $f_i$ are large multi-digit numbers, direct multiplication is tedious and error-prone. We choose a convenient central value of $x_i$ as the Assumed Mean ($a$).


2. The Deviation Formula

For each class, compute deviation $d_i$:

$$\mathbf{d_i = x_i - a}$$
  • Central deviation is $0$.
  • Preceding deviations are negative.
  • Succeeding deviations are positive.
$$\mathbf{\bar{x} = a + \frac{\sum f_i d_i}{\sum f_i}}$$

Key Advantage: Deviations are much smaller integers, and positive and negative terms cancel each other out, making the sum $\sum f_i d_i$ very small!

๐Ÿ“
Comprehensive High-Yield Mathematical Relations & Theorems

Complete step-by-step derivations, step traps, and LaTeX formula sheet breakdowns...

๐Ÿ”’

End of Free Notes Preview

Unlock the complete deck to access full LaTeX formula breakdowns, interactive diagrams, exam traps, and personal margin highlights!

๐Ÿ”‘ Sign In / Register Free
๐Ÿ”’
Step 4 is Locked

Diagnostic Quiz & Mastery MCQs: CBSE Class 10 Board Standards

This ๐Ÿ“ LaTeX Concept Notes is part of the full verified curriculum for Chapter 13: Statistics. Unlock the full deck to gain permanent access to all 13 interactive stages, active recall cards, and diagnostic checkpoints.

Deck Access Price
100% Free with Account
Instant Access
โœ“ UPI & Cards Supported
๐Ÿ”‘ Sign In / Register to Unlock Free →
๐Ÿ”’
Step 5 is Locked

Diagnostic Quiz & Mastery MCQs: CBSE Class 10 Board Standards

This ๐Ÿ“ LaTeX Concept Notes is part of the full verified curriculum for Chapter 13: Statistics. Unlock the full deck to gain permanent access to all 13 interactive stages, active recall cards, and diagnostic checkpoints.

Deck Access Price
100% Free with Account
Instant Access
โœ“ UPI & Cards Supported
๐Ÿ”‘ Sign In / Register to Unlock Free →
๐Ÿ”’
Step 6 is Locked

Diagnostic Quiz & Mastery MCQs: CBSE Class 10 Board Standards

This ๐Ÿ“ LaTeX Concept Notes is part of the full verified curriculum for Chapter 13: Statistics. Unlock the full deck to gain permanent access to all 13 interactive stages, active recall cards, and diagnostic checkpoints.

Deck Access Price
100% Free with Account
Instant Access
โœ“ UPI & Cards Supported
๐Ÿ”‘ Sign In / Register to Unlock Free →
๐Ÿ”’
Step 7 is Locked

Diagnostic Quiz & Mastery MCQs: CBSE Class 10 Board Standards

This ๐Ÿ“ LaTeX Concept Notes is part of the full verified curriculum for Chapter 13: Statistics. Unlock the full deck to gain permanent access to all 13 interactive stages, active recall cards, and diagnostic checkpoints.

Deck Access Price
100% Free with Account
Instant Access
โœ“ UPI & Cards Supported
๐Ÿ”‘ Sign In / Register to Unlock Free →
๐Ÿ”’
Step 8 is Locked

Diagnostic Quiz & Mastery MCQs: CBSE Class 10 Board Standards

This ๐Ÿ“ LaTeX Concept Notes is part of the full verified curriculum for Chapter 13: Statistics. Unlock the full deck to gain permanent access to all 13 interactive stages, active recall cards, and diagnostic checkpoints.

Deck Access Price
100% Free with Account
Instant Access
โœ“ UPI & Cards Supported
๐Ÿ”‘ Sign In / Register to Unlock Free →
๐Ÿ”’
Step 9 is Locked

Diagnostic Quiz & Mastery MCQs: CBSE Class 10 Board Standards

This ๐Ÿ“ LaTeX Concept Notes is part of the full verified curriculum for Chapter 13: Statistics. Unlock the full deck to gain permanent access to all 13 interactive stages, active recall cards, and diagnostic checkpoints.

Deck Access Price
100% Free with Account
Instant Access
โœ“ UPI & Cards Supported
๐Ÿ”‘ Sign In / Register to Unlock Free →
๐Ÿ”’
Step 10 is Locked

Diagnostic Quiz & Mastery MCQs: CBSE Class 10 Board Standards

This ๐Ÿ“ LaTeX Concept Notes is part of the full verified curriculum for Chapter 13: Statistics. Unlock the full deck to gain permanent access to all 13 interactive stages, active recall cards, and diagnostic checkpoints.

Deck Access Price
100% Free with Account
Instant Access
โœ“ UPI & Cards Supported
๐Ÿ”‘ Sign In / Register to Unlock Free →
๐Ÿ”’
Step 11 is Locked

Diagnostic Quiz & Mastery MCQs: CBSE Class 10 Board Standards

This Microlearning Step is part of the full verified curriculum for Chapter 13: Statistics. Unlock the full deck to gain permanent access to all 13 interactive stages, active recall cards, and diagnostic checkpoints.

Deck Access Price
100% Free with Account
Instant Access
โœ“ UPI & Cards Supported
๐Ÿ”‘ Sign In / Register to Unlock Free →
๐Ÿ”’
Step 12 is Locked

Diagnostic Quiz & Mastery MCQs: CBSE Class 10 Board Standards

This ๐Ÿง  Active Recall Flashcards is part of the full verified curriculum for Chapter 13: Statistics. Unlock the full deck to gain permanent access to all 13 interactive stages, active recall cards, and diagnostic checkpoints.

Deck Access Price
100% Free with Account
Instant Access
โœ“ UPI & Cards Supported
๐Ÿ”‘ Sign In / Register to Unlock Free →
๐Ÿ”’
Step 13 is Locked

Diagnostic Quiz & Mastery MCQs: CBSE Class 10 Board Standards

This โšก Diagnostic Quiz is part of the full verified curriculum for Chapter 13: Statistics. Unlock the full deck to gain permanent access to all 13 interactive stages, active recall cards, and diagnostic checkpoints.

Deck Access Price
100% Free with Account
Instant Access
โœ“ UPI & Cards Supported
๐Ÿ”‘ Sign In / Register to Unlock Free →